Finances
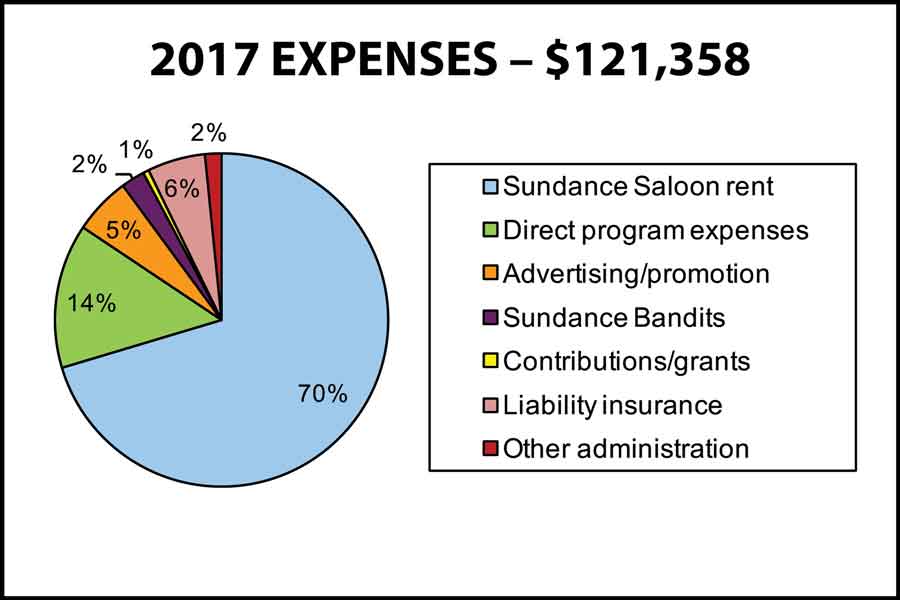
In 2017 our expenses totaled a little over $120,000. 70% of our expenses goes towards rent, primarily for our space at 550 Barneveld, but some for our special event facilities for Pride and NYE. We spend 14% on supplies and other support of our programs, only 2% for administration.
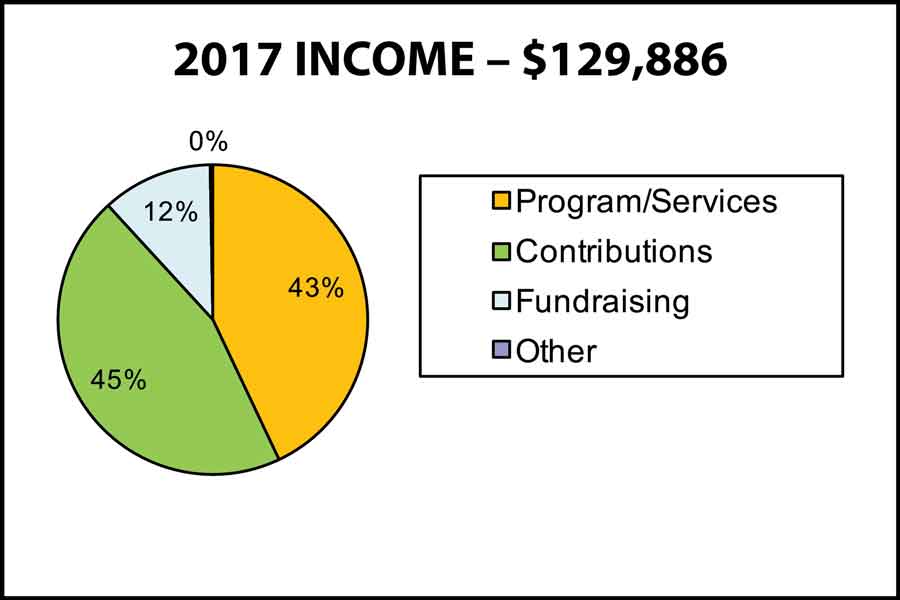
In 2017 our income totaled over $129,000. Surplus years and deficit years tend to balance themselves out. Over the past twenty years we have created a reserve cushion of about $100,000.
- 43% of our income is from admission to Sundance Saloon and other events.
- A roughly equal amount comes from financial contributions ($50,000 from membership donations, and another $8,000 from matching contributions and other sources).
- 12% comes from fundraising: we keep half the proceeds of the Country Dance-A-Thon, and one-third of the net proceeds from the Sundance Stompede.
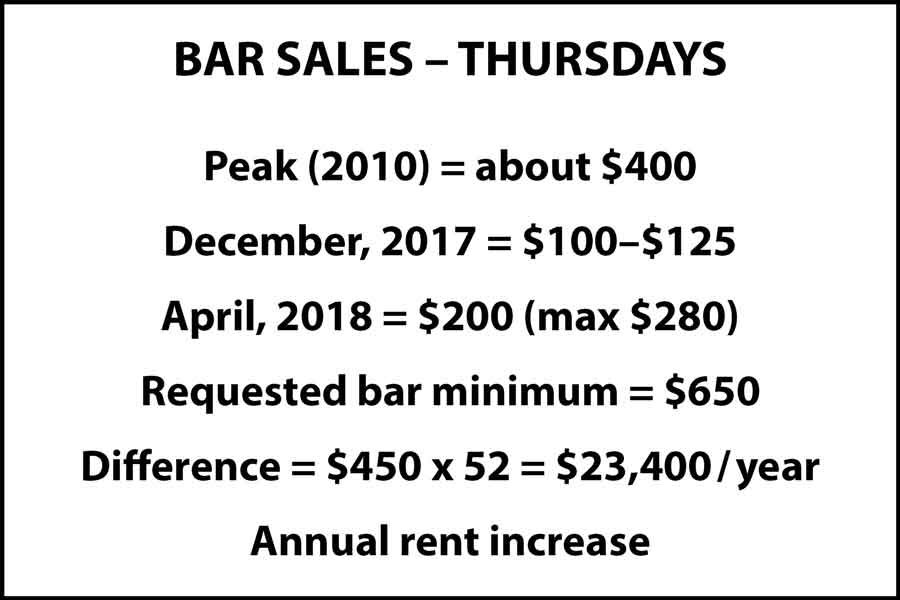
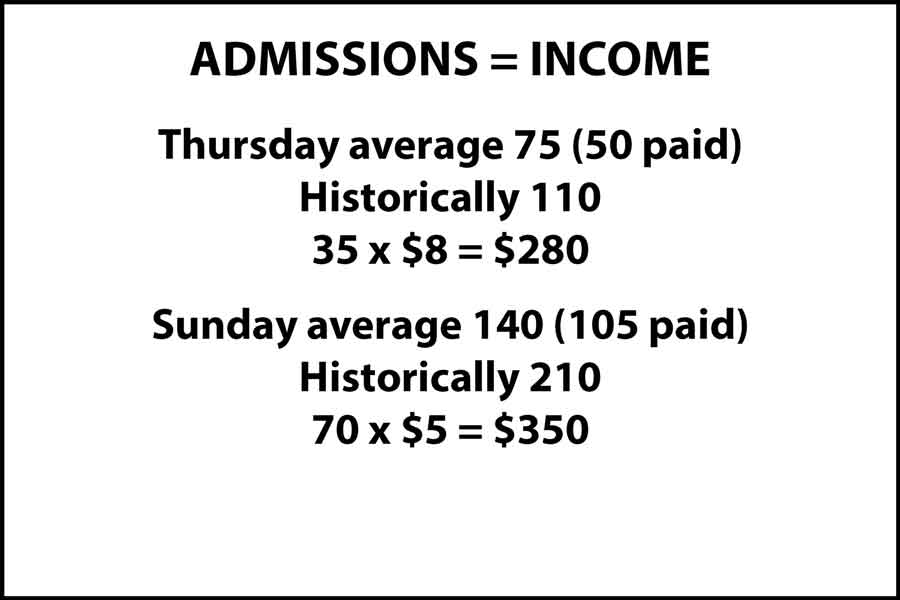
In December the club expressed concern over the lack of bar sales on Thursdays, which had fallen to $100 to $125. (Several years ago, typical bar sales on Thursdays were about $400.) Thursday admissions at that time were about 60, so this represents about $2 per person, a very low figure considering a bottled water costs $3. We were given a vague ultimatum to fix this.
We began some effort to increase bar sales, and by April Thursdays were averaging about $200. But this was still not good enough, and now the club is asking for a $650 bar minimum on Thursdays, with us paying any difference, estimated to be $450 per week, for an annual total of $23,400.
In addition we can expect a rent increase on Sunday and Thursday starting this July, from $850 per night to $950 per night. With this rent increase the club is offering a reduced Thursday bar minimum to $550. So this effectively adds another $5,000 to our annual expenses. We expect this rent increase to continue annually.
So in sum, we are expecting in increase in expenses of about $30,000 for the coming year, and perhaps $10,000 annually after that.
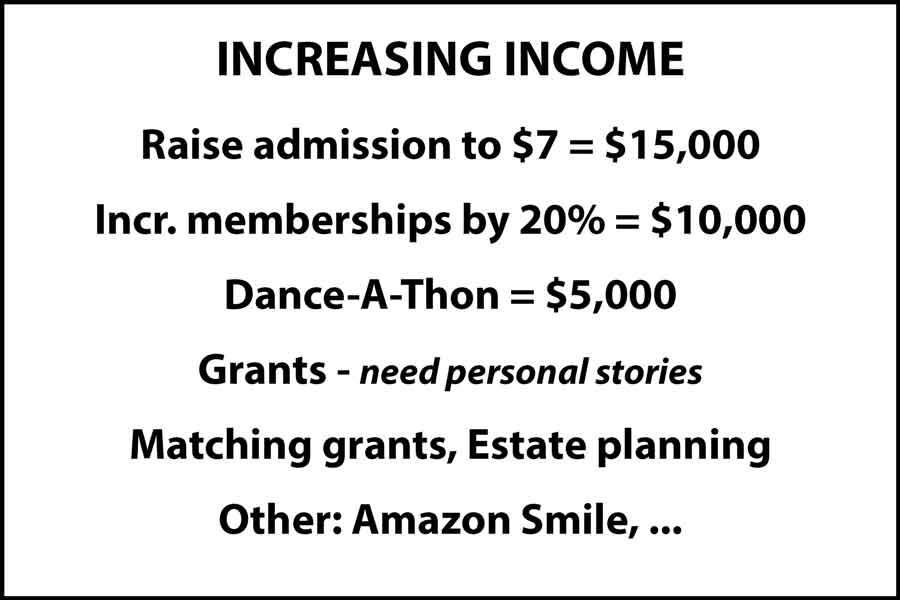
Here's how we propose to make up this additional $30,000 in expenses:
- Raise admission to $7. We'll probably delay this until January. This will give us $15,000 annually. (Discussion about increasing it even further, up to $10. Discussion of a sliding scale.)
- Increase membership donations by 20%. We currently receive $50,000 annually. This would give us an additional $10,000.
- Increase Country Dance-A-Thon participation. Each of the last two years Sundance earned about $5,000 with 15 active participants. If we doubled participation, that could mean an additional $5,000. This is our best way to raise funds outside of our dance community! More info ...
Those three items alone would allow us to reach our $30,000 target.
Additional methods:
- Grants. We need to show that we are more than just a place to go out and have fun. Sundance is so much more than that! We'd like to have your personal stories that tell the world what Sundance means to you, and what you think it means to the community. Send these to info@sundancesaloon.org.
- Matching grants. Many larger companies will match your donation. Last year we received several thousand dollars from such programs. Please check to see if your company matches! Some companies also "match" volunteer time and will pay Sundance for your volunteer work.
- Estate gifts. Consider making a gift to the Sundance Association in your will.
- Other fundraising. (e.g. Hamilton raffle, Bandits' bake sale)
- Use Amazon Smile if you shop on Amazon. It's the exact same website with the same products and same prices. Amazon will pay Sundance 0.5% of your purchase price.
- Use the coat-check on Sundays. The $2 goes directly to Sundance (and your coat stays clean and secure).
- Buy drinks at the bar on Thursdays. Every dollar you spend is a dollar Sundance doesn't have to. Any beverage counts -- bottled water and Gatorade included.
- Drop a dollar or two or five in the donation box at Sundance Saloon each time you visit. Many folks have suggested a sliding scale admission structure. Think of this as your sliding scale!
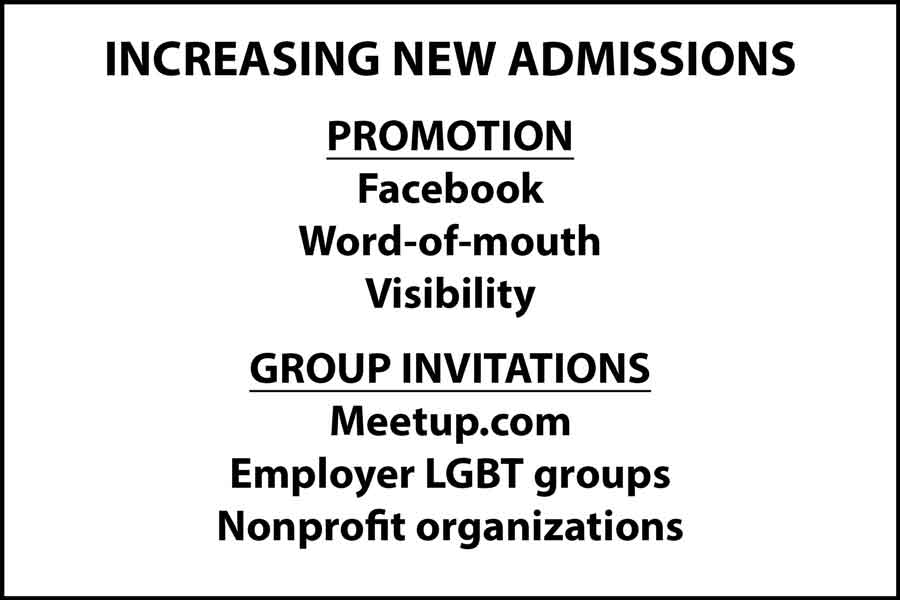
- Increase attendance. The second part of this meeting will be devoted to this concern.
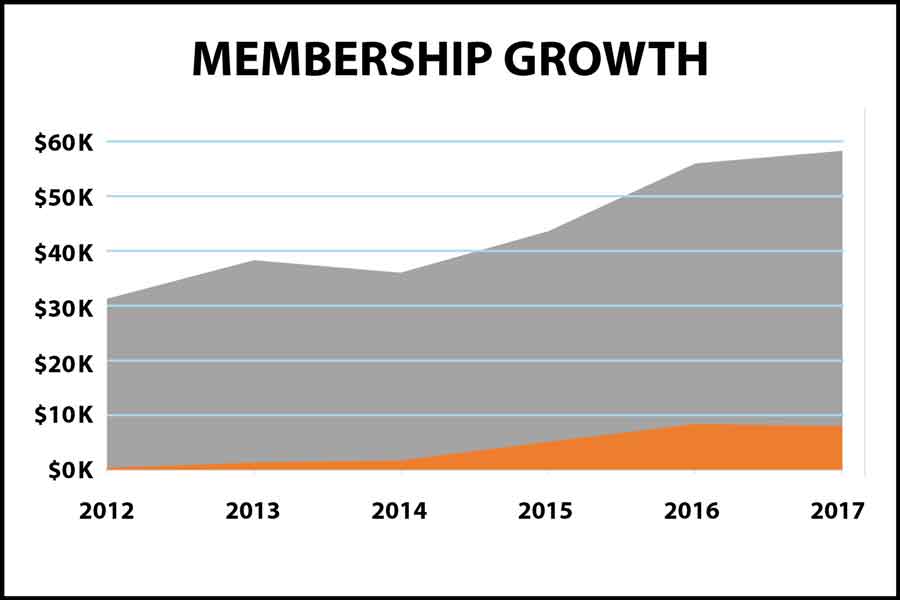
This chart shows our income from financial contributions increasing from $30,000 in 2012 to nearly $60,000 in 2017. The orange section represents matching grant and similar contributions. The gray section is actual member donations.